


Why single metrics in isolation fall short and how Weighted Composite Scoring can transform your business insights
In the world of e-commerce, relying on individual metrics to assess product and brand performance can be misleading. Metrics, in isolation, can create a false sense of success, leading to overinvestment in products that appear profitable but are actually draining your business’s resources or undervaluing items with untapped potential.
To stay ahead, you need a holistic view — one that evaluates product and brand performance across several key metrics like gross revenue, conversion rate, gross margin, customer acquisition cost, repeat purchase rate, fulfillment costs, and return rate.

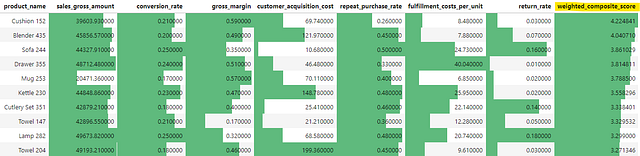
However, when we sort by a custom score that considers all the metrics equally, we find that ‘Cushion 152’ emerges as the best-performing product, while ‘Towel 17’ drops significantly to position 213 out of 500 products.
To avoid these pitfalls of single metric assessment and to gain a more accurate evaluation of product and brand performance across multiple metrics, we use a method called Weighted Composite Scoring.
A Weighted Composite Score combines multiple metrics into a single, insightful metric that provides a comprehensive view of each product’s value across various dimensions. This composite score can also be weighted to emphasize specific metrics, aligning with particular business goals.
Next, let’s explore how to implement a Weighted Composite Score using Python:
import pandas as pd
from sklearn.preprocessing import StandardScaler, MinMaxScaler
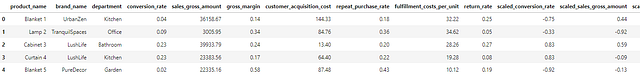
product_df= pd.read_csv('product_data.csv') # This is a set of artificially generated data
product_df.head()

There are many scaling techniques you can apply, but for this dataset, Z-Score Normalization is the most effective scaling method. Z-Scores help balance different scales, handle outliers better, and identify above/below-average performance.
Refining with Min-Max Scaling
While Min-Max scaling alone wouldn’t have been suitable for scaling the raw data in this dataset, we applied it after Z-Score Normalization to transform all the values into a consistent range between -1 and 1, allowing for fair comparison of metrics.
The code below demonstrates how to apply the scaling methods to our dataframe:
  # Select numeric columns and create corresponding scaled column names
  numeric_cols = product_df.select_dtypes(include=['float64', 'int64']).columns
  scaled_cols = ['scaled_' + col for col in numeric_cols]

  # Apply Z-Score Normalization and then Min-Max scaling in one go
  scaler = MinMaxScaler(feature_range=(-1, 1))
  product_df[scaled_cols] = scaler.fit_transform(StandardScaler().fit_transform(product_df[numeric_cols]))
Next, we provide the option for end users to add weights to certain metrics, allowing them to prioritize metrics based on business objectives. Applying negative weights to some metrics ensures that higher values in those metrics lower the overall composite score, reflecting their adverse impact.
  # Example user-provided weights (this can be dynamic based on user input)
  user_weights = {
    'scaled_conversion_rate': 0.14,
    'scaled_sales_gross_amount': 0.14,
    'scaled_gross_margin': 0.14,
    'scaled_customer_acquisition_cost': -0.14,
    'scaled_fulfillment_costs_per_unit': -0.14,
    'scaled_return_rate': -0.14,
    'scaled_repeat_purchase_rate': 0.14
  }

  # Calculate weighted composite score
  product_df['weighted_composite_score'] = sum(product_df[col] * weight for col, weight in user_weights.items()) / sum(user_weights.values())
Weighting Metrics with Regression Analysis
A more data-driven approach to assigning weights is to use regression analysis, which assigns weights based on each metric’s actual influence on key outcomes. When we order by the new weighted composite score, different products and brands emerge as top performers, providing valuable insights for optimization and decision-making.
In conclusion, implementing a Weighted Composite Score is a simple yet highly effective method for analyzing complex datasets and gaining valuable business insights. This approach has proven to prevent unnecessary cuts to underperforming products and reallocate resources effectively, leading to improved profitability and customer satisfaction.
Weighted Composite Scoring can be a transformative tool across various areas of your business, optimizing decision-making and enhancing overall performance. If you need help implementing a weighted scoring system or want to discuss your data challenges, feel free to reach out.
Unless otherwise noted, all images are by the author.